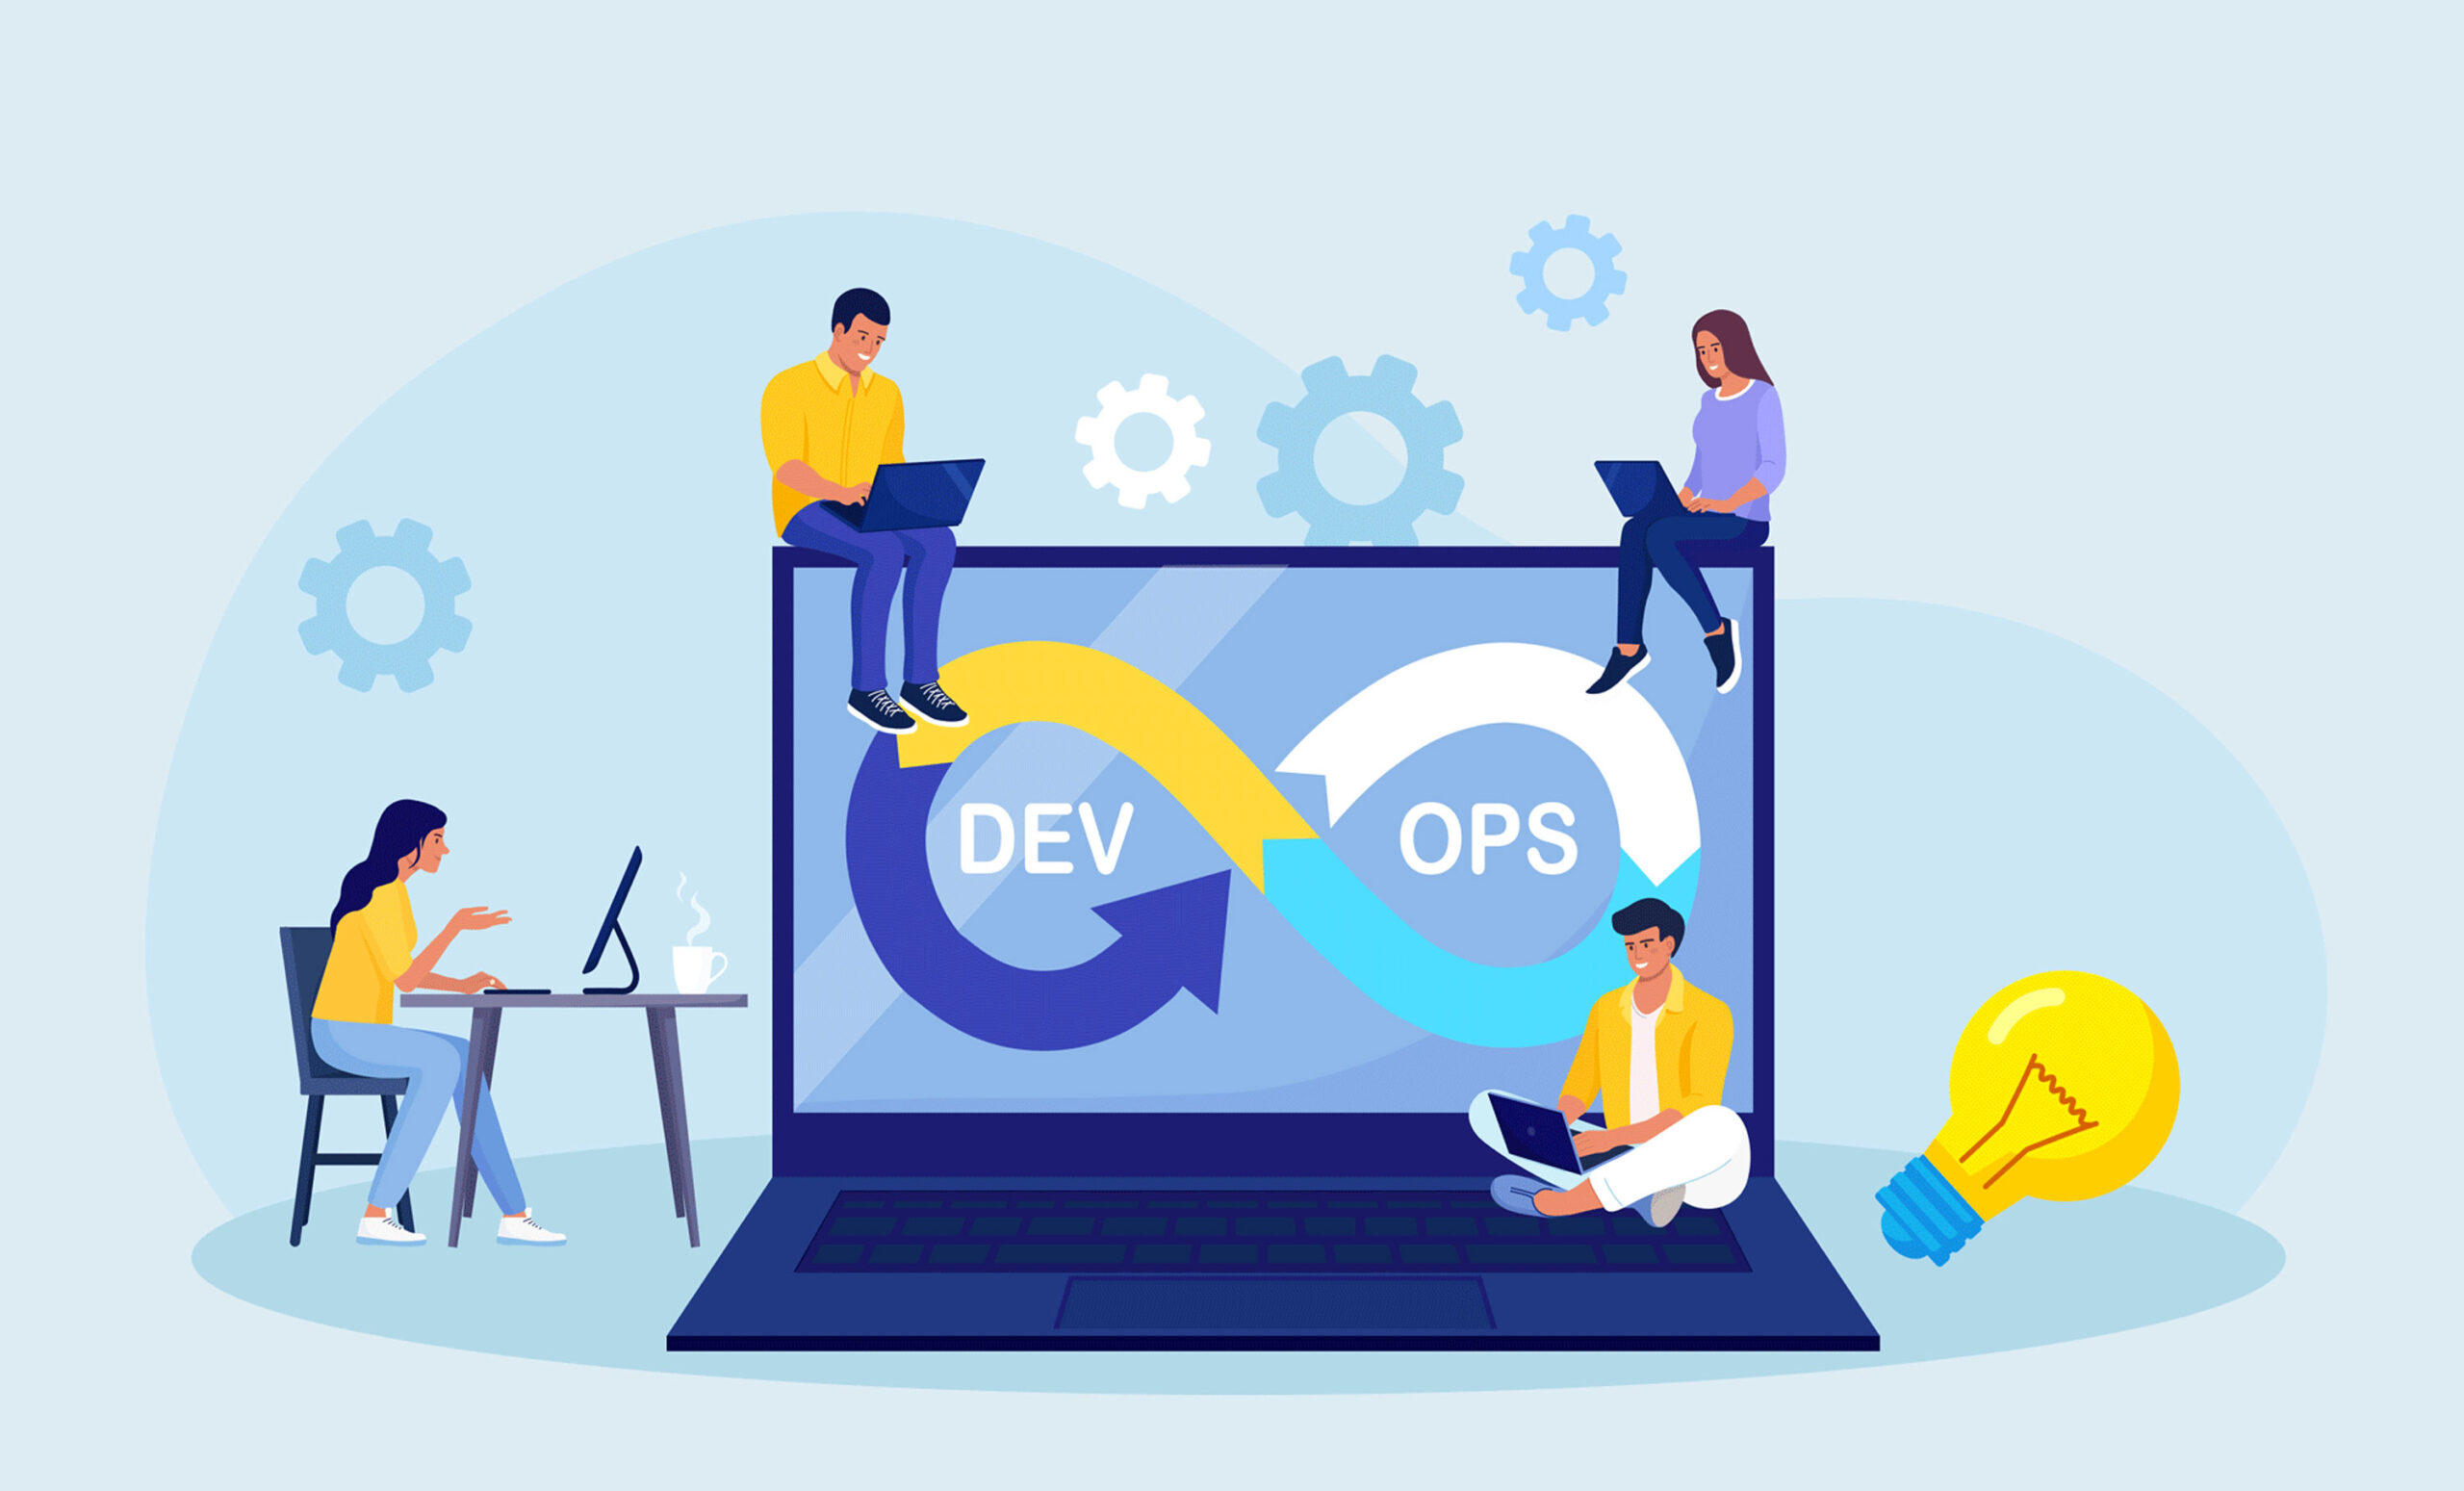
Pipeline Debugging Checklist
Every engineer knows the feeling: you push your code, wait for the build, and see a red failure icon. A broken build stops deployment in its tracks and kills productivity. When panic sets in, it is easy to start guessing at solutions, but that rarely works. What you need is a systematic approach. A comprehensive pipeline debugging checklist is the most effective way to turn that red status back to green quickly and calmly.
Here is your essential guide to troubleshooting CI/CD failures without the stress.
- Analyze the Logs (Don’t Just Skim)
The first step on your pipeline debugging checklist is a proper log review. Most developers make the mistake of only reading the last few lines of the output. However, the final error message often just says “Process Exited,” which is a symptom, not the cause. You need to scroll up to find the first failure. Look for the specific warning or error that started the cascade. A failure in line 500 is often caused by a configuration warning in line 50. - Validate Environment Variables
A major cause of pipeline failure is a mismatch in environment variables. Your local machine has a .env file that your CI/CD runner does not see. Verify that every secret, API key, and configuration variable your code needs is actually defined in your pipeline settings. Checking for typos or missing variables is a critical part of any pipeline debugging checklist, as a simple missing string can cause complex application crashes. - Replicate the Issue Locally
Debugging directly in the cloud is slow and frustrating. To fix issues faster, recreate the environment on your local machine. If you are using Docker, pull the exact image used by your CI/CD runner and execute the build commands inside it. This isolates the problem from the infrastructure and allows you to test fixes in seconds rather than waiting minutes for a new pipeline run. - Lock Your Dependencies
If your pipeline worked yesterday but fails today, a dependency update is likely the culprit. Using “floating” versions in your package manager can pull in breaking changes unexpectedly. Ensure you are using a lockfile (like package-lock.json or yarn.lock) to guarantee that your CI/CD runner installs the exact same versions as your local machine. - Check Resource Limits
Pipelines run on servers with limited CPU and memory. If your build is crashing silently or timing out, you may be hitting a resource ceiling. Monitoring resource usage is an advanced but necessary step in your pipeline debugging checklist. If your tests or build processes are too heavy, you may need to optimize your Dockerfile or upgrade your runner instance. - Fix Flaky Tests
Finally, do not ignore tests that fail intermittently. These “flaky tests” erode trust in your deployment process. If a test fails once, investigate it immediately. It usually points to a race condition or a dependency on external data. A reliable pipeline must be deterministic—passing or failing for the same reasons every time.
Conclusion
Fixing a broken pipeline does not have to be a guessing game. By following a structured pipeline debugging checklist, you can isolate issues faster, reduce downtime, and build a more reliable deployment process for your whole team.
Share this article
Follow us
A quick overview of the topics covered in this article.
Latest articles
March 31, 2026
March 31, 2026
March 31, 2026


